Hello, I'm Maneshwar.
I'm building git-lrc, a Micro AI code reviewer that runs on every commit.
It is free and source-available on Github.
Star git-lrc to help devs discover the project.
Do give it a try and share your feedback.
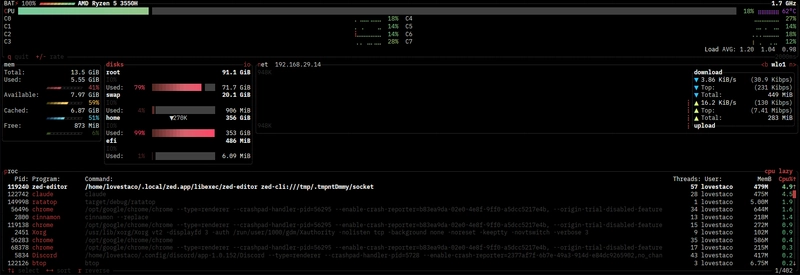
CPU, memory, disks and network were all "read a file, do some arithmetic, draw it".
This one is different.
It reads about 400 directories every tick, and it is the first box you can actually interact with.
There is one bug in here that I would bet real money most parsers have shipped at some point.
Let me start there.
The parentheses that ruin everything Here is a line from : Space separated.
Field 1 is the pid, field 2 is the process name in parentheses, field 14 is user time, field 15 is system time, field 20 is thread count, field 24 is resident memory.
So you split on whitespace and index into the result.
Obvious.
Works perfectly.
Until someone runs a process called .
That name is three whitespace-separated tokens, so every field after it shifts by two.
Your thread count is now reading someone's page fault counter.
Your memory is reading a scheduling priority.
Nothing crashes.
The numbers are just quietly, confidently wrong.
And the process name is fully user-controlled.
Anyone can rename a thread to whatever they like.
The fix is to not split the whole line at all.
Find the last closing parenthesis, take the name from between the first and that, and only then split what remains: instead of .
That is the entire fix, and it is why the man page for explicitly warns you about this field.
The offset is worth a look too.
The man page numbers fields from 1, and the two we consumed manually were 1 and 2, so field 14 lives at index 11 of what is left.
I wrote it as a closure that takes the man page's number directly, so the code reads and matches the documentation rather than making you do arithmetic while reviewing it.
Percent of what, exactly?
Second decision that changes what the numbers mean.
A process's CPU time is in clock ticks.
To turn that into a percentage you need a denominator, and there are two reasonable choices: Percent of one core.
A single-threaded process pinning a core shows 100%.
A process using four cores shows 400%.
This is what does by default.
Percent of the whole machine.
That same core-pinning process shows 12.5% on my 8 core laptop, and the whole table sums to at most
- btop defaults to the second, so that is what I did.
The denominator is the total tick delta across every core, which I already had from the CPU box: Neither is wrong.
But you have to pick one and say so, because "4.9" means very different things under each, and a user comparing your tool to htop will notice the factor of eight immediately.
The spike that isn't Subtle one, and it took me a moment to reason about rather than observe.
CPU percentage is a delta between two samples.
A process that started since the last sample has no previous sample to subtract from.
If you treat its absent baseline as zero, you compute its entire lifetime CPU time as if it were consumed in the last two seconds.
Every freshly spawned process would flash at some enormous number, immediately sort to the top, and then drop back to reality on the following tick.
Reporting zero for one tick is a small lie.
Reporting 60% for a process that just started is a much larger one.
Sorting floats is not sorting Quick Rust one that catches everybody once.
Every other column sorts with : CPU is an , and that does not compile. requires , and floats only implement , because compares false against everything including itself.
A type where can be false cannot have a total order.
So the CPU column needs the explicit version: Treating an incomparable pair as equal is the pragmatic call here.
A percentage would be a bug upstream, and I would rather the row sit in an odd position than the whole table panic.
A stock widget, finally Four boxes in and I had not used a single ratatui widget that draws data.
Everything was , , and my own braille graph and meter